The unitary patent and opt-out statistics: one year in
We have previously explored uptake of both the unitary patent (UP) and the opt-out in articles published three months and six months respectively after the UPC agreement came into force. This article looks at how the picture has changed now the twelve month threshold has passed.
Technical field of UPs
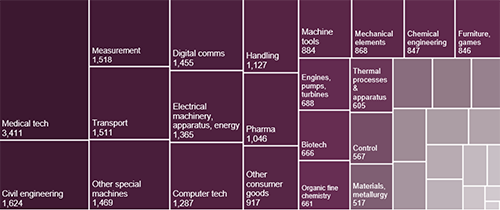
The graphic below illustrates the proportion of UPs obtained so far for each of the 35 technology fields defined by the World Intellectual Property Organization (WIPO). The relative share of UPs obtained by technical field remains fairly well distributed, with no technology fields seeing their share fall or rise particularly sharply.
It still appears that some of the more contentious technology areas or those in which patents have a higher individual value, such as chemistry, pharmaceuticals or biotechnology, have a relatively lower UP uptake rate than patents in the mechanical or electronic fields. This can likely be explained by the fact that, although a greater cost effectiveness could potentially be achieved through the UP compared to validating individually in the traditional manner, the risk of central revocation at the UPC is too high. Many patentees in these fields would therefore appear to be more willing to spend a little more money to obtain patent protection across a broad selection of states while opting their patents out of the UPC.
WIPO’s technology fields (international patent classification)

Procedural language (left) and translation language (right)

Language choice for patent translation
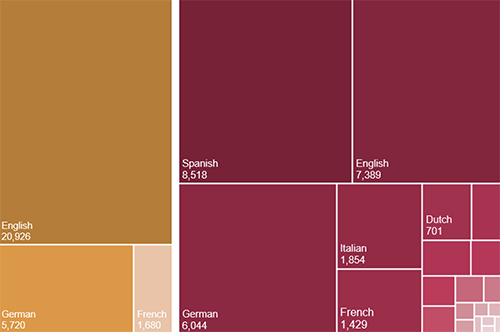
Upon filing, a request for unitary effect to obtain a UP a full translation of the patent specification in one of the languages of the European Union must be filed. A little over a quarter of these translated specifications, where the procedural language of the patent is French or German, must be English. However, for all patents where the procedural language of the patent is English, it is up to the applicant to choose the language of translation.
By far the most popular choice of translation language is Spanish, with 30.1% of all requests for unitary effect (UP requests) being accompanied by the filing of a translation of the patent into Spanish, with 40.7% of all UP requests for patents where the procedural language of the patent is English being accompanied by a Spanish translation.
It seems that this is widely used as a cost-saving tactic by applicants. Spain is not a member of the UPC, somewhat ironically due to the Spanish Government’s objection to the Spanish language not being chosen as an official language of the UPC. This means that the only way to obtain patent protection in Spain is by validating a granted European patent in the traditional way at the Spanish Patent and Trademark Office (OEPM), which requires a full translation of the specification into Spanish. Patentees are therefore able to make use of this same translation to obtain a UP and a Spanish national patent.
The 30.1% figure is a little higher than the 28.6% of UP requests accompanied by a Spanish-translated patent seen by the start of December 2023, when the UPC Agreement had been in force for six months. Similarly, the 40.7% figure is higher than the 39.7% of UP requests for patents with English as the procedural language accompanied by a Spanish-translated patent seen by the same point. This perhaps is indicative that Spanish has cemented itself as the most popular translation language for English patent specifications. Another factor to note is that the number of granted European patents for which UP requests have been filed, where the language of procedure is English, has risen slightly with respect to German and French, from around 72% to roughly 73.9%. This may suggest that a higher share of non-European patentees, whose patents are more likely to use English as the procedural language, are obtaining UPs than at the start of the UPC system.
Opt-outs
When the UPC came into effect on 01 June 2023 it was reported that 418,095 applications to opt European patents out of the court’s jurisdiction had been filed during the three-month sunrise period that preceded it. Since that date a further 112,354 opt-outs have been filed, taking the total number to well in excess of half a million. Interestingly, the number of opt-outs filed from 01 June 2023 to 01 June 2024 (112,354) is greater than the number of European patents granted in 2023 (104,609).
Clearly, with large numbers of UPs being obtained, patentees and applicants are still playing catch-up in terms of opting out their European patents and patent applications, and only a proportion of the opt-outs filed in the past twelve months were filed for European patents at the time of grant. When this factor is viewed in combination with the approaching end of the transitional period in June 2030 (though, of course, this may yet be extended), it may reasonably be expected that the number of opt-out applications will drop off over the coming years, although this will remain to be seen.
UP registration status and uptake rate
As of 01 June 2024, 27,609 UPs have been registered, with another 654 requests pending, 34 requests withdrawn, 26 requests rejected, and 3 registered UPs now lapsed.
The European Patent Office (EPO) indicates that the uptake rate of UPs (the number of granted European patents for which unitary effect was requested) was 17.5% for the calendar year 2023. During 2024 to date the uptake rate is 24.0%: a significant increase.
While the difference in these figures can be mostly explained by the fact that UPs could only be obtained from 01 June 2023 (for only a little over half of 2023) it was possible from 01 January 2023 to delay grant of European patents until after the UPC system began, so as to take advantage of the possibility of requesting UPs for those patents. So, perhaps another factor in explaining the increase in UP uptake rate for 2024, when compared to 2023, is simply an increase in popularity of UPs among applicants.
With Romania having deposited its instrument of ratification on 31 May 2024, the number of states in which UPs will have effect will rise to 18 on 01 September 2024. This may prompt a further small rise in the UP uptake rate.
UP requests by country of applicant
In our October 2023 UP statistics update (see ‘useful link’ below), we explored how the number of UP requests as compared to granted patents changed with respect to the country of applicant. It was shown that there was a large difference in UP take-up for European based applicants compared to those from the USA or East Asia. At the time, we noted that greater familiarity with the European patent system and the higher importance of markets in smaller European states where protection was therefore desired may be been among the reasons for this.
The countries considered in that article included France, Germany, and the Netherlands (European nations covered by the unitary patent), the UK and Switzerland (European nations not covered by the unitary patent), and non-European nations Japan, China, South Korea, and the USA. The table below shows how the relative proportion of UP requests across those nine nations has changed since that article was published.
Unitary patent requests September 2023 compared with June 2024
| Country | UP requests 17 September 2023 (number) | UP requests 17 September 2023 (%) | UP requests 01 June 2024 (number) | UP requests 01 June 2024 (%) | % change |
|---|---|---|---|---|---|
| Germany | 1,834 | 29.49 | 5,334 | 28.43 | -1.06 |
| USA | 1,327 | 21.34 | 4,211 | 22.45 | 1.11 |
| France | 738 | 11.87 | 1,977 | 10.54 | -1.33 |
| Switzerland | 536 | 8.62 | 1,549 | 8.26 | -0.36 |
| China | 492 | 7.91 | 1,563 | 8.33 | 0.42 |
| UK | 410 | 6.59 | 1,159 | 6.18 | -0.41 |
| Japan | 319 | 5.13 | 1,026 | 5.47 | 0.34 |
| Netherlands | 343 | 5.52 | 1,013 | 5.40 | -0.12 |
| South Korea | 220 | 3.54 | 929 | 4.95 | 1.41 |
As can be seen, the relative share of UP requests filed over the past twelve months is greater for all five non-European nations and lower for all four European nations, as compared to the snapshot taken on 17 September 2023. On the opposite ends of the scale France’s share of the total number of UP requests filed by applicants from these countries has decreased by 1.33%, while South Korea’s share of UP request filed by applicants from among these countries has increased by 1.41%”.. It therefore seems as though uptake of the UP is beginning to increase in non-European nations, at least in relative terms, as the UPC system ticks over into its second year.
Useful link
EPO statistics & trends centre: dycip.com/epo-up-statistics

